The media coverage of the results of the local elections (in May 2019) has at times been deeply misleading with voting outcomes not being accurately described. The problem is two-fold. First, the usual way of presenting the figures – in terms of seats, percentage share of the vote and swings – can give a very misleading impression. It has on this occasion as the usual metrics have been distorted by the plummeting turnout compared to 2015 (when the turnout was high due to the General Election). No one single summary statistic can be relied upon in all circumstances. Second, it is nigh on impossible to get the actual voting figures. The country deserves a central publication point for election data to allow anyone to do their own, neutral, assessment of the trends. The time has come for the UK to have more transparency about its election results – surely one of the most fundamental of all statistics – as befits a developed democracy. Without this, the voters are unlikely to get a fair sense of the results given much of the interpretation is being done by politicians or columnists skilful enough to select their factoids to suit their own story or others who are innumerate, wilfully or naively ignorant of the facts, or producing projections from black box models.
What did the election results show?
Thanks to Wikipedia we have a two para summary: “The Conservatives lost control of 44 councils and more than 1,300 council seats. It was the worst Conservative local election performance since 1995, when the party lost more than 2,000 seats. Labour, despite topping national polls, lost 6 councils and more than 80 seats. Labour lost votes in heavily Brexit-voting areas, while making gains in some other places. Parties supporting remaining in the EU performed well. The Liberal Democrats made the most gains of any party, while the Greens also picked up seats with the largest percentage growth. There was also a significant increase in the number of independent and local party councillors, with their number of seats more than doubling.”
The main metric used in the analysis is the number of seats won/lost (and it’s aggregated format of councils won/lost). At one level – and certainly in the council chambers – that is the important number.
But what do the number of seats tell us about trends of political opinion and the factors that were driving voter action? In particular, does the jump in Lib Dem seats show a rising appeal of the Lib Dem message or a desire to stop Brexit as many have said?
The Guardian had a piece from Bridget Phillipson, the Labour MP, who said (my underlining): “That pattern held across England – both Labour and the Tories saw votes that have previously been cast for them move elsewhere, above all to the parties that want us to stay in the EU.”
Andrew Grice in the Independent took a similar line. “The big winners were the re-energised Lib Dems, whose clear pitch as the party of Remain and a Final Say referendum did not stop them making gains in Tory-held areas in the south ……. the Lib Dems scooped up Remainers in the south ……. results will raise Lib Dem hopes that their coalition nightmare may finally be coming to an end …… The Lib Dems will be confident of building on their success at the European elections, and eclipsing Change UK at its first test. The new party’s view that the Lib Dems are going nowhere is now open to question; they are alive and kicking.”
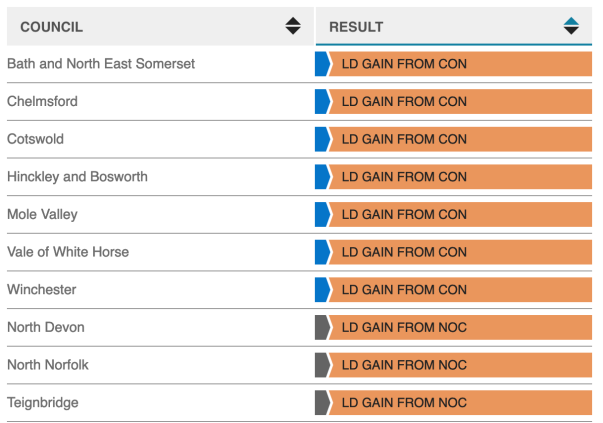
The Observer had a piece from Robert Ford, professor of political science at the University of Manchester. It said: “The big winner was the Liberal Democrat party, which announced its return as a force in local government with hundreds of seat wins and some major local council takeovers. ………….. The Lib Dem vote surged by a remarkable 15 points on average in such areas, delivering hundreds of seats and control of 10 councils, restoring the party to something like its pre-Coalition vitality in its traditional south of England heartlands such as Somerset, Winchester and Chelmsford.”
Andrew Rawnsley, Chief Political Commentator of the Observer, added: “The main beneficiary in these elections were the Lib Dems, up by more than 700 seats. They were due a revival after the savaging inflicted on their local government base during their time in office with the Tories. Voter memories of Lib-Dem participation in the coalition may be softening ……. The Lib Dems are returning to their historical role, which is to outperform at a council level and offer a home for voters discontented with the big two. In many parts of the country, the Lib-Dem surge was augmented by its appeal to anti-Brexit voters as a party unequivocally in favour of a fresh referendum.
Sadly very little of the repeating narrative of Lib Dem vote surge can be said to be true on the basis of what was known. Some insight into this becomes clear by looking at the number of votes cast. I chose Chelmsford as a case study. (A “case study” is needed as, as I explain, the votes data is not readily available to analyse.) Chelmsford was one of the ten Lib Dem council gains from the Conservatives featured on the BBC election summary page.
The “Heavy Conservatives losses in Essex” story got quite some attention. As the BBC story put it: “All 57 seats in Chelmsford were up for grabs on Thursday’s poll, and the Liberal Democrats gained 26, mostly at the expense of the Conservatives who lost 31. Independent candidates won five seats. At the Chelmsford count, Ms Ford (the local Conservative MP) became emotional as she reflected on “a very disappointing night”.
I dug out the numbers for Chelmsford. (It’s a boring exercise getting the numbers as you have to find the relevant page of each council’s website, then, depending on the council, you have to crawl over pdf or html records hidden away on websites. Each council is different and there is no central record.)
I had wanted to do the analysis for Bath, also a big favourite in the media, but it became clear – and here’s another problem – that the ward boundaries had changed between the 2015 and 2019 elections so it was not possible for me to do the work. I should also say that I’d have loved to do the analysis for 2011 as well to better understand the impact of the larger GE-related turnout in 2015 but, without data, I can’t.
Looking at the Chelmsford data (see my excel spreadsheet Local election results 2019 Chelmsford), the story of these elections was not about a Lib Dem surge in support. There hasn’t been a surge in support. It was about turnout and the failure of Conservative supporters to vote. The simple mean of turnout percentage in each of the 24 wards fell from 69% in 2015 to 33% in 2019. Instead of two in three voting, it was only one in three. Half of those voting in 2015 couldn’t be bothered this time.
Within the aggregate fall in turnout, the Lib Dem vote held solid. Total Lib Dem votes rose fractionally from 38,000 to 39,000 across Chelmsford. It wasn’t that rise that got the Lib Dems the bulk of their new seats, rather that was as a result of the Conservative vote falling from 97,000 to 40,000. In some wards the Lib Dem vote rose and in others it fell, but in three quarters of the wards the change per candidate was less than 200, ie not much either way. Certainly not enough of a change or a consistent enough change to make a story out of (without having, for example, the 2011 data to compare with).
Such large changes to turnout are very rare (and occurred in these elections as 2015 coincided with the GE which boosted voter numbers then) but they also do funny things to the traditional metrics. Given turnout tumbled it’s a shame that none of those pieces above wrote about its (possible, probable) impact. But, as ever, the failure to get to grips with the numbers can even lead experts astray.
To recap, the claims in the articles above from the experts included:
- “the Lib Dems scooped up Remainers in the south”
- “ …… both Labour and the Tories saw votes that have previously been cast for them move elsewhere, above all to the parties that want us to stay in the EU”
- “The Lib Dem vote surged by a remarkable …. restoring the party to something like its pre-Coalition vitality in its traditional south of England heartlands such as Somerset, Winchester and Chelmsford.”
- “The Lib Dems are returning to their historical role, which is to outperform at a council level and offer a home for voters discontented with the big two ….”
It’s not clear that these are true statements and they almost certainly are not the main story.
It’s not clear, of course, why such experts have drawn these conclusions. It is possible that they did their best in the absence of decent accessible data. But you’d expect experts to look hard for the numbers to support their lines. It is also possibly the case that naively they relied too much on the common currency of the debate, the seats, swings and percentage of vote figures – as opposed to actual votes cast. Again, one might expect better. A less generous interpretation is that the arguably lazy use of headline numbers just suited their pre-determined narrative. It has always been the case that too many people use statistics selectively to provide evidence for only one side of a multi-sided contentious topic. It’s another example of the well-known saying: Some individuals use statistics as a drunk man uses lamp-posts — for support rather than for illumination. This feature has become even more pronounced in the Brexit era of the last three or four years.
Even the generally brilliant Godfather of political analysis Professor Sir John Curtice summing up on BBC radio seemed to miss the main point. Two examples: “In seats where the Liberal Democrats were second to the Conservatives, double-digit swings from the Tories to Lib Dems are commonplace.” and “Now, good news for Ed Davey is this does look to us like the best Liberal Democrat local performance since his party went into coalition with the Conservatives in 2010.”
Neither statement is untrue as there were double digit swings to the Lib Dems in some Chelmsford wards but the almost negligible rise in the votes cast for them suggests that “good news for Ed Davey” is not such good news.
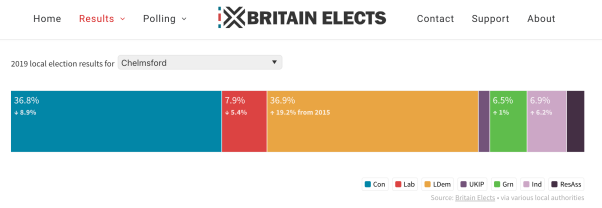
The graphic below from BritainElects demonstrates how the usual metrics can be misleading. It shows a 19% increase in the vote share of the Lib Dems, and a 9% fall in the Conservative share, compared to 2015. It’s easy to see how someone who doesn’t look at the underlying numbers – or doesn’t want to look at them – might get the wrong end of the stick about the extent of pro-EU voting. It’s a 14% swing to the Lib Dems after all!
The three wards below are examples of the extreme case – where the Lib Dem vote actually fell but the seats switched from Conservative to Lib Dem (because the Conservative fell so very much more). Obviously winning a seat is great for the Lib Dems but it is less impressive for the national voting intentions picture (or as an indicator of Brexit leanings) and less likely to be sustained in future elections if it’s done on the back of fewer votes than in 2015. Again, if the data were there to be seen – including that for 2011 – the electorate might be a bit wiser about the underlying trends.


The charts above show percentage share data but it is sometimes summarised in the swing figure – and that was not a better single indicator for describing what’s going on in this case. As a Parliamentary Briefing explains: “Electoral swing is ….. often used to analyse the performance of parties over time or in one election between different electoral areas. The basis of calculating swing is each party’s percentage share of the vote. The swing from Party A to Party B is conventionally defined as the average of the percentage point fall in Party A’s share of the vote and the percentage point rise in Party B’s.” Often it gives a reasonable sense of what’s happening but in the extreme cases like these local elections it too fails.
All this points to the need for the figures for election results to be collated in one place. It seems that there have been attempts to do so, such as a project by the ESRC. It might not be right for an overtly political part of government (for example a department under ministerial control) to publish the data but there are any number of “independent” bodies funded by the taxpayer (ie voter) that could or should do so. There is no reason why the Office for National Statistics could not collate them and publish them in a single place, in a reusable format. If they were unwilling, they could be mandated by the UK Statistics Authority and have the figures classified as trustworthy National Statistics. UKSA could also use its influence to improve poor use of data.
Alternatively, the Electoral Commission overseas elections and could provide the service. It already publishes lots of election data but it’s about turnout, postal votes and other such metrics that enables it to carry out its job. There’s no data about who won and votes cast for each candidate/party but it would be a modest job to add it. Or perhaps the House of Commons Library could help out?
The nation’s voters deserve better.
Note added 7/5/2019: Do try this blog on “Interpreting local election results” from Christopher Huggins.
Note added 7/5/2019: I have been pointed to The Elections Centre: “The Centre compiles, analyses and publishes local election data in Britain. These data are available as election results, summarised in tables and displayed in graphics”. Sadly I fear this is published with long delay and in pdf format.

I think you are making a mistake here. These seats were last contested in 2015 in General Election Day, when turnout is roughly double a local election.
A better comparison is with 2011 when the same seats were contested without a GE on the same day. The turnout was similar but results very different.
For the Lib Dem’s to achieve GE vote totals in a local election is an exceptional performance (it’s incredibly rare), for the Tory vote to halve from GE to local is not unexpected.
The experts were right. In the seats you analysed Lib Dem performance was the story.
LikeLike
You MIGHT be right but without the published data for 2011 I can’t begin to know.
LikeLike
Thank you. As a LibDem supporter (and unsuccessful candidate in the South Norfolk District Council elections 2019), this makes interesting reading. A dash of cold hard reality is helpful when thinking about strategy.
LikeLike
Great post and long overdue. I analysed the raw data for constituencies, comparing 2010, 2015 and 2017 GE. What was clear was that the increase in Tory votes in 2017, matched or was less than the decline in UKIP vote; the LD vote was remarkably stable between 2015 and 2017 and didn’t go to Labour. Instead the increase in the Labour vote in 2017 was equal to the increase in turnout.
In both John Mann’s constituency in Bassetlaw and Dennis Skinner in Bolsover, the actual number of Labour votes increased but their respective majorities decreased because of the transfer of Ukip votes to the Conservatives and a relative lack of increase in overall turnout. There was no evidence that Jeremy Corbyn’s leadership affected the Labour vote as John Mann insisted.
Another irritation is the one that you describe above. For example in Lewes constituency which the LDs lost in 2015 , the Conservative vote only increased by a few hundred but the LD vote collapsed, essentially because Labour supporters stopped voting tactically. Cameron’s supposed achievement in gaining a majority govt (to his surprise) was largely due to same effect. Labour’s withdrawal of support for the LDs was not sufficient to get a Labour seat but was enough to allow the Tory through.
In fact, the Conservatives had a strategy of targetting 80 constituencies and it appeared to be very successful in the SW but I doubt its effectiveness. My data indicated that the collapse of support for the LDs in 2015 was pretty consistent nationally .. and indeed the Tories did absolutely no campaigning in Lewes which they considered a safe LD seat and they still won the seat.
LikeLike
This is much more convincing than the #libdems won the day.
You might like to have a look at an unusual result in Brighton & Hove: outer city seat held for aeons by a tory couple plus a third ever-changing tory candidate, the couple retired for 2019 so a keen fight this time to establish a new regime.
In Brighton now Greens vie mostly with Labour with tories only recently ousted and keen libdem competition in some wards.
The Greens won after much local hard work and good organisation, fair enough though an outcome hard to predict.
However you have to add that on a 50% turnout it was won by approx a 1,000 seat margin for each candidate! That sort of swing isn’t usually achieved in one fell swoop. The LibDems lost some but it was theTories that collapsed. It is usually assumed that tory voters always turn out, everyone else has to fight for every vote – not this time.
LikeLike
Interesting stuff. Any chance you could take a look at the actual votes cast for labour and others in, for eg, Bolsover, Trafford, Bolton?
LikeLike
Excellent article- thanks for analysing what happened. I think you are being far too generous to some of the so called ‘experts’ and their sloppy analysis.
LikeLike
I agree totally about the need for better data on election results, and thanks for flagging.
Just to add another uncertainty though – both the article and a number of the comments talk about “X party voters” doing something – switching, not turning out, turning out. Any such statement is always going to be speculative. We have no information on who actually voted which way – that is the essence of a secret ballot. In the case study given, it may well be that the same people have voted Lib Dem over more than one election, and that other people have voted Conservative and then not voted in the next election. It is also very likely that some people voted Conservative last time, and Lib Dem this time, or didn’t vote last time and voted Lib Dem this time, and so on. Of course, we have some evidence that people quite often vote for the same party, because we ask them. However, we don’t actually know. All of which is to say that while there may be better and worse analysis, there is no certainty about what is causing any particular electoral result.
LikeLike
Inclusion of data regarding spoiled ballots would also be very illuminating
LikeLike
Tremendous work. Thanks. It is as I had surmised. Would you now do Sunderland, please?
LikeLike
This analysis is a lot closer to my casual observations that the expert analysis. Because there are non-voters as well as Con, Lab, Lib etc the swing model will always fail. Worth looking at Souh Lakeland where there were all out elections last year and so no GE bias in the base. We think the Con vote was suppressed by about 20% either not turning out or else drawing cocks on the ballot paper. There was no swing just the Cons got about 20% less and so LDs were elected, and even a Green.
The same phenomenon in Craven, Richmondshire and Eden where the beneficiaries were even more random
LikeLike
You can’t seriously compare turnout from a general election year and a local election. Just to illustrate that – according to the House of Commons library, turnout for 2017 local elections were on average 33-34.6% (depending on type: district councils had slightly higher than metropolitan councils, for example). The turnout a month later at the general election was 68.8%. This article rests on a completely flawed premise.
LikeLike
I really don’t agree here – the article is making exactly your point. The problem is the expert analysis is ignoring the distinction and hence coming up with the unwarranted conclusions being offered in the mainstream press.
LikeLike